| ElectroEncephaloGraphy (EEG) | |
| EEG records the difference of the electric potential between locations on the scalp surface and a reference point, which is either located on the scalp surface too or close by like the earlobe, tip of the nose, forehead or mastoid. By its physical nature, the electric potential is not an absolute quantity in space but depends on the location of the reference, a fact that has led to serious disputes and controversies within the EEG community regarding what is the `best' spot. Fortunately, certain quantities, like the so-called surface Laplacian discussed below, can be derived from raw EEG that do not depend on the reference and even improve spatial resolution. To enhance signal quality, EEG is usually recorded inside a well-grounded and electrically shielded room (Faraday cage) with DC lighting. | 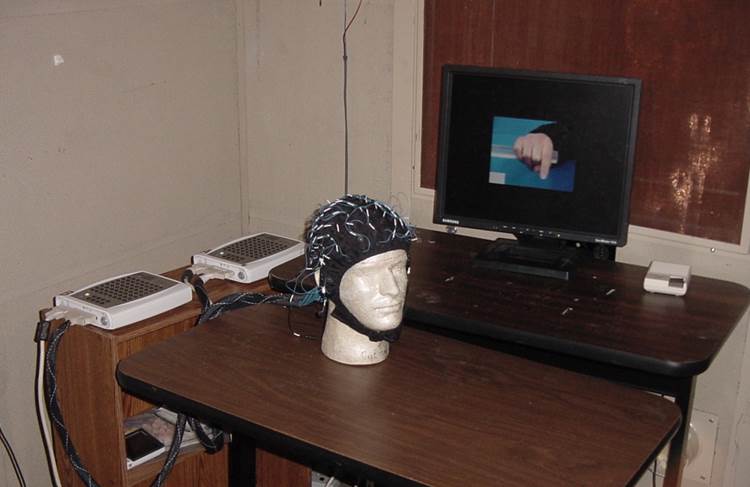 |
 | The
signals recorded by EEG
originate from electric activity in the cerebral
cortex, where pyramidal neurons are arranged in columns and act
coherently leading to a summation of extra-cellular currents
perpendicular to the cortical surface and eventually to a potential
difference between different locations on the scalp. EEG
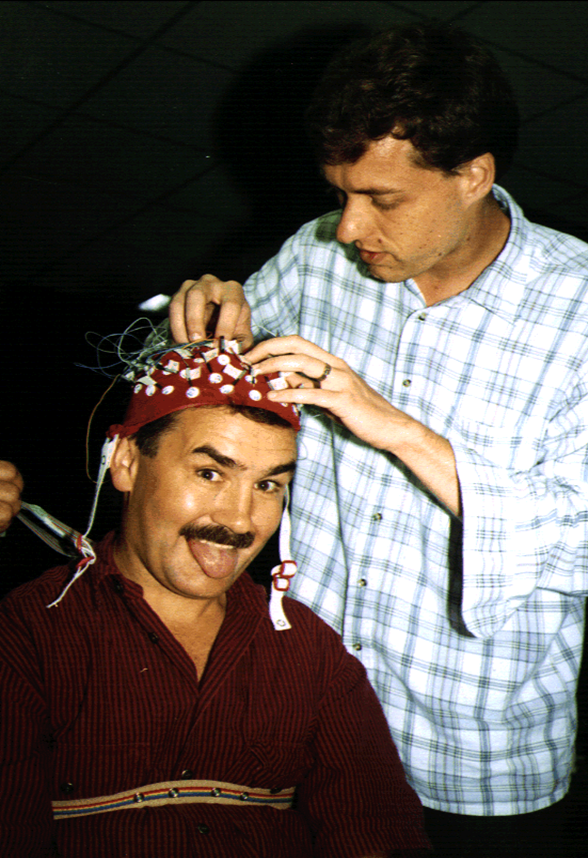
recordings are performed by attaching electrodes to the scalp by either
gluing them to the skin or putting on a cap they are mounted on. A
conductive gel is injected into the electrodes to ensure a good
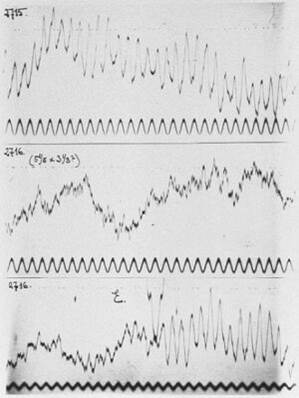
electrical connection to the skin. Typical EEG data from adult
humans show oscillations with an amplitude of tens of micro volts and
frequencies in the range of 0.1-50Hz depending on the physiological
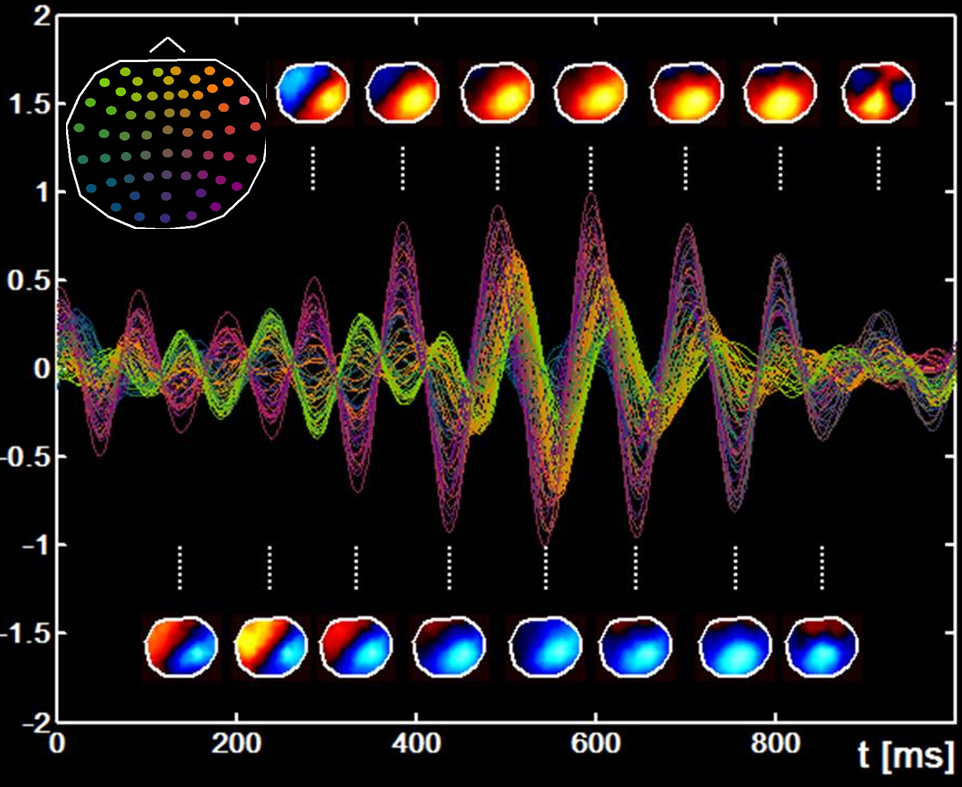
state like asleep, awake, aroused, relaxed etc. The image on the left shows one second of an EEG recording from 64 electrodes with the time series color-coded due to the electrode location on the scalp (insert upper left) and the patterns of the electric potential on the scalp at the maxima. The signals are band-pass filtered 7-13Hz. |
| In our lab EEG has been used to study neural activity while subjects were listening to auditory stimuli at different rates or coordinating finger movement with an auditory or visual metronome in a syncopated or synchronized fashion. Of particular interest are the changes in the activity patters that take place when subjects switch spontaneously from syncopation to synchronization, which happens when the stimulus rate is systematically increased. In recent years studies of social coordination were performed where EEG is collected simultaneously from two subjects under conditions where they could either watch their partners' behavior or their view was blocked. The goal of these experiments is to find out whether, and if in what way, coordination or cooperation (or non-cooperation) on the behavioral level is manifested in the brain and can be found in the activity patterns from EEG recordings. | 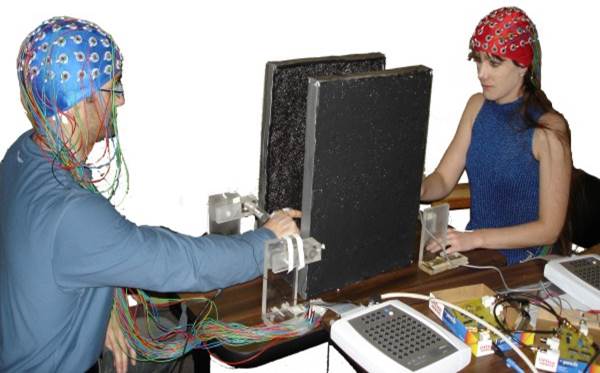 |